


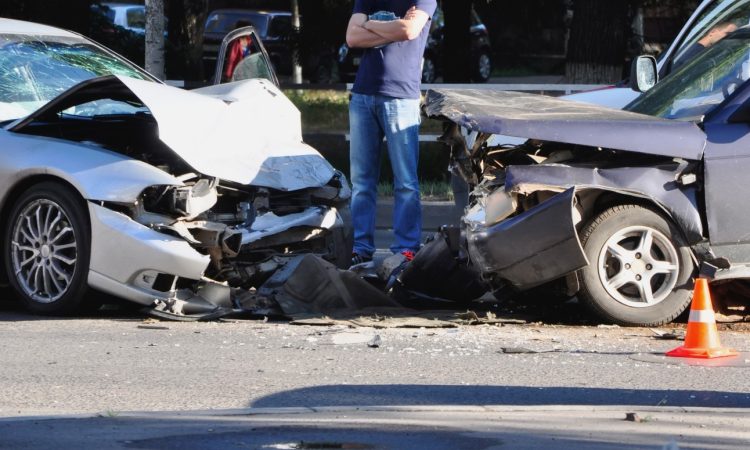
When a serious crash raises hard questions, how fast, who turned, what failed, accident reconstruction provides the answers grounded in physics, not guesswork. If someone’s freedom, fault, or financial recovery depends on what really happened, understanding What Is Accident Reconstruction and how it’s used can make or break a case. From measuring tire marks to decoding a vehicle’s “black box,” qualified experts translate scattered evidence into a reliable timeline that courts can trust. Law firms like Stracci Law Group often rely on these findings to clarify liability, challenge assumptions, and present clear, visual narratives to judges and juries.
The science behind recreating crash dynamics and vehicle movement
Accident reconstruction blends classical mechanics with on‑scene evidence to reverse‑engineer a collision. In plain terms, it’s physics plus forensics.
At its core are conservation laws: momentum and, where appropriate, energy. Analysts look at pre‑impact speeds, directions, and vehicle masses to estimate how forces exchanged during impact produced the final rest positions and damage patterns. When vehicles skid or yaw (rotate while sliding), friction between tires and pavement becomes a measurable brake on motion. That’s why a single arc‑shaped yaw mark can often reveal speed more reliably than a witness’s best guess.
Key building blocks include:
- Tire marks and road scars: ABS-era vehicles rarely leave long, locked-wheel skids, but they do leave intermittent scuffing, yaw marks, and impact gouges. Each tells a slightly different story about steering input, braking effort, and timing.
- Crush profiles: Measuring how far body panels intruded (the “crush”) allows experts to estimate impact severity using empirically derived stiffness data and algorithms (e.g., CRASH3, SMAC variants). The result, called Equivalent Energy Speed (EES), correlates with how hard a vehicle was hit.
- Time–distance analysis: Who had the right‑of‑way is one thing: who had time to avoid the crash is another. Analysts evaluate perception‑reaction time (commonly 1.5–2.5 seconds under alert daytime conditions), braking distances, and available sight lines to test whether a maneuver was even possible.
- Human factors: Visibility, conspicuity, glare, occlusions from parked cars, and driver workload matter. A left‑turner hidden by an A‑pillar or a pedestrian emerging from behind a box truck changes what a “reasonable” driver could perceive.
- Vehicle dynamics: Weight transfer under braking, understeer/oversteer tendencies, and stability control activation shape how a car actually moves in the split seconds before impact. Modern systems leave digital breadcrumbs, too.
A key principle: uncertainty is quantified, not ignored. Good reconstructions don’t produce a single magic number: they bracket likely ranges and test sensitivity. Many analysts use Monte Carlo simulations to vary inputs, like friction or reaction time, and see how those shifts affect conclusions. That transparency is part of why judges often admit these opinions under Daubert or Frye standards.
In short, reconstruction takes messy, real‑world clues and builds a physics‑consistent narrative of pre‑impact motion, impact dynamics, and post‑impact travel. It’s careful, technical work designed to separate coincidence from causation.
Tools and software experts use for scene and speed analysis
Today’s reconstructions are equal parts measurement and modeling. The toolkit has expanded well beyond a tape measure and a camera:
- Laser scanning and lidar mapping: FARO and Leica scanners capture millions of points to create a centimeter‑accurate, 3D digital twin of the crash scene, lanes, curbs, slopes, even subtle roadway crowns. This matters for grade (uphill/downhill) and visibility analyses.
- Drone photogrammetry: UAVs pair high‑resolution imagery with ground control points to rapidly map large scenes or long debris fields. Orthomosaic maps and point clouds feed directly into CAD and reconstruction software.
- Event Data Recorders (EDRs): Many vehicles store pre‑crash data, speed, throttle, braking, steering, seatbelt use, and airbag deployment timing. With manufacturer‑approved tools (Bosch CDR is the standard), experts download and validate these logs. EDRs don’t cover everything, but when available, they’re gold.
- Video analysis: Dashcams, intersection CCTV, and even doorbell cameras provide frame‑by‑frame speed and position data. Using perspective correction and pixel‑to‑distance scaling, analysts can derive vehicle speeds with known confidence intervals, accounting for frame rates, shutter effects, and lens distortion.
- Friction testing: Drag sleds and instrumented brake tests establish the actual friction coefficient (mu) for that surface and condition. Fresh slurry seal? Light drizzle? Those details can swing speed estimates by double‑digit percentages.
- Simulation and visualization software: Programs like HVE (EDSMAC4), PC‑Crash, Virtual CRASH, and ARAS 360/HUD create physics‑based simulations and clean visuals. These aren’t video games: inputs must be grounded in measured data, and outputs must be validated against physical evidence.
- Data fusion and CAD: AutoCAD, Revit plugins, or specialized scene diagramming tools assemble measurements, photos, and scans into scaled exhibits. The best visuals let jurors “stand” at a sight line or watch time‑aligned vehicle paths.
Importantly, tools don’t replace judgment. A high‑fidelity model that ignores a curb strike, or mislabels a tire scuff as a skid, can mislead. Experienced practitioners cross‑check every output against hard evidence: rest positions, crush, debris fans, and EDR timestamps. That loop, measure, model, verify, is the heartbeat of credible analysis.
How reconstruction evidence supports both civil and criminal trials
Accident reconstruction sits at the intersection of engineering and law. In both civil and criminal courts, it helps answer different but related questions.
Civil cases (injury and wrongful death):
- Liability clarity: Was the left‑turning driver negligent, or did the through‑vehicle approach too fast to be seen? Time–distance models and sight‑line analyses bring objectivity to what witnesses debate.
- Comparative fault: Jurors can apportion responsibility more fairly when they see, for instance, that a motorcyclist’s headlight misalignment reduced conspicuity, while a pickup’s speed trimmed available stopping distance.
- Damages causation: Biomechanics and delta‑V (change in velocity) estimates inform medical causation opinions and expected injury patterns. A modest bumper tap rarely generates high delta‑V: a corner impact with rotation can.
- Product liability: Reconstruction isolates whether a tire failure precipitated the crash or resulted from it, or whether an ADAS sensor misread lane markings. That distinction matters in suits against manufacturers.
Criminal cases (e.g., vehicular homicide, reckless driving):
- Speed and behavior proof: Prosecutors must establish elements like “recklessness” or “gross negligence.” EDR downloads showing sustained high speed or no braking can be pivotal: defense experts may show obstructed views or unavoidable timing.
- Impairment context: Toxicology alone doesn’t prove causation. Reconstruction can demonstrate whether, even if impaired, the defendant’s actions were or were not the proximate cause of the fatal outcome.
- Admissibility and standards: Courts often apply Daubert/Frye to ensure methods are reliable and properly applied. Chain of custody for EDR data and scene evidence is essential.
Across both realms, strong visuals matter. Jurors grasp vector diagrams and synchronized video far faster than they digest tables of numbers. That’s why trial teams, including firms like Stracci Law Group, frequently pair experts with skilled demonstrative artists so the science lands with laypeople.
Coordinating expert reports with law-enforcement findings
Police crash reports are invaluable, but they serve a different mission: document, classify, and support immediate enforcement decisions. Reconstruction experts don’t replace that work, they deepen it.
Best practices for coordination include:
- Early evidence preservation: Communicate quickly to preserve vehicles, download EDRs before batteries die, and document perishable marks before weather or traffic degrades them. A short delay can erase critical clues.
- Respecting roles: Officers may estimate speeds using standard formulas and templates: experts expand with full scene scans, sensitivity analyses, and advanced modeling. Disagreements aren’t confrontations, they’re refinements with additional data.
- Chain of custody and transparency: Maintain meticulous logs for downloads, photos, and measurements. Clear metadata and versioned files prevent admissibility challenges.
- Reconciliation memos: Where findings diverge (e.g., friction value or mark classification), experts explain why, cite sources, and show validation against physical evidence. Courts appreciate a paper trail.
- Collaborative briefings: When possible, aligning exhibits and timelines avoids confusing the factfinder with dueling diagrams. The goal is accuracy, not point‑scoring.
Eventually, coordinated efforts help judges and juries see a consistent, evidence‑anchored story rather than a clash of opinions.
